Field guide
IT service health tracking as a practiced craft
A SystemNode Core lens on building a data visualization and analytics platform for IT service health tracking — without mistaking more panels for more control.
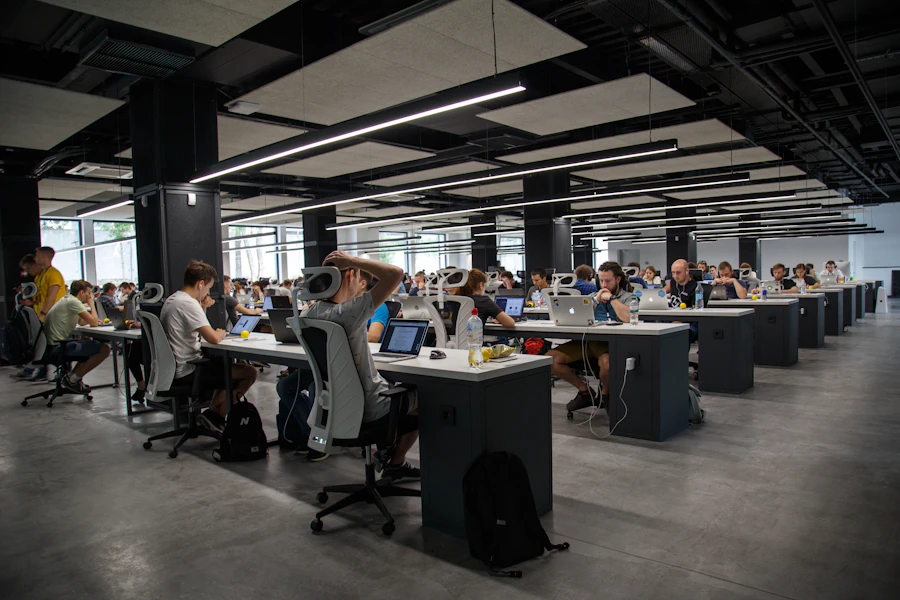
Three layers that must agree
Signals — the measurements you trust enough to act on. Surfaces — the boards and digests that arrange those signals for a human under time pressure. Rituals — the reviews, escalations, and handoffs that keep surfaces honest after the launch demo fades.
Most stalled “health platforms” invest heavily in the middle layer and neglect the other two. Our courses force all three into the same conversation.
What “platform” means here
We are not selling software. Platform means a repeatable way your organization selects metrics, composes views, and explains service risk. Tools come and go; the agreements should travel.
A working sequence
1. Name the audience
On-call, service owners, and executives need different densities. One canvas rarely serves all three well.
2. Bound the service
Draw what is in and out of scope. Orphan dependencies create green boards with red customers.
3. Choose sparse SLIs
Prefer a handful of defended indicators over a wall of unowned charts.
4. Design for glance, then drill
Severity first. Detail second. Decoration last.
5. Overlay change carefully
Deployments and tickets explain many spikes — and invent causes when overused.
6. Schedule maintenance
Assign owners and a monthly prune. Untended boards become fiction.
Where training helps
If your telemetry is incomplete, take platform engineering work in parallel — visualization cannot invent missing counters. If your telemetry is rich but unread, Service Health Dashboards and our workshops are built for that gap.